INTRODUCTION TO LABORATORY PRACTICE
Laboratory apparatus
An apparatus is a tool or an equipment
that is required in order to perform a
particular activity or task effectively during
the teaching or learning process. Each
apparatus in a laboratory is specifically
designed for a specific use which includes
heating, measuring and storage while others
act as containers. Tables 2.3 and 2.8 show
the classification of laboratory apparatus
according to their application.
-
Laboratory Apparatus
-
Basic principles of scientific investigation
-
Revision exercise 2
Table 2.3:
Instruments/Apparatus for measuring length and time
| Apparatus | Picture / 3D | Uses |
|---|---|---|
| Meter Rule |
|
Measure length up to 100cm. |
| Tape measure |
|
Measure length or distance of 1m and above. |
| Vernier caliper |
|
Measure length, depth, internal and external diameter of cylindrical objects more accurately. |
| Micrometer screw gauge |
|
Measure the diameter of a wire, hair, and very small objects more accurately. |
| Stopwatch |
|
Measure time |
Table 2.4:
Instruments/Apparatus for measuring mass and weight
Apparatus
Picture / 3D
Uses
Spring balance
Measure force/weight in Newtons
Triple beam balance
Measure mass of substance
Digital balance
Measure mass of a substance more accurately
Triple lever arm balance
Measure mass of a substance
Table 2.5:
Instruments/Apparatus for measuring volume of liquids
Apparatus
Picture / 3D
Uses
Beaker
Measure volume and heating liquids
Measuring cylinder
Measure volume of liquids
Burette
Dispense and measure volume of liquid more accurately
Pipette
Transfer specific but small volumesof liquids
Table 2.6:
Instruments/Apparatus for heating purposes in the laboratory
Apparatus
Picture / 3D
Uses
Bunsen burner
Source of heat
Wire gauze
Support beaker or flasks during heating
Tripod stand
Provide stability and support for glassware such as beaker and flask.
Calorimeter
Measure amount of heat of a liquid
Test tube
Hold and heat chemicals and liquids
Kerosene stove
Source of heat.
Gas container
Hold a gas which is used as the source of heat in the laboratory
Test tube holder
Hold a test tube during heating
Table 2.7:
Instruments/Apparatus for electrical measument
Apparatus
Picture / 3D
Uses
Ammeter
MeMeasure electric current
Voltmeter
Measure voltage
Galvanometer
Detect and indicate the direction of an electric current
Electric cell/ battery
Source of elecromotive force(emf)
Rheostat
Vary resistance in electric circuit
Battery holder
Hold battery
Bulb
Source of light
Plug key
Turn ON and OFF electricity in a circuit
Connecting wires
Connect electrical devices in a circuit
Metre bridge
Determine unknown resistance of a resistor or a conductor.
Resistance box
Estimat and compare resistances.
Table 2.8:
Instruments/Apparatus for light experiment
Apparatus
Picture / 3D
Uses
Plane mirrors
Looking glasses
Lenses
Magnify and diminish images of objects.
Curved mirror
Concave for shaving; in torches.
Convex for vehicle side mirrors
Drawing boards
Draw the path of rays of light
Optical pins
Used as object in light experiments
Triangular glass prism
Show the minimum angle of deviation and separate white light into its constituent colours(recall rainbow)
Rectangular glass block
Used to demonstrate the concept of refaction of light rays
Task 2.4
Visit the following school premises;
and then, answer questions (i) - (iii)
(a) Physics laboratory.
(b) Chemistry laboratory.
(c) Biology laboratory.
(i) List the items you see in each
room and their uses.
(ii) List the items that are commonly
found in all laboratories.
(iii) Discuss these items in groups.
Scientific method is an experimental
procedure used in constructing and testing
a scientific hypothesis or law. A scientific
method consists of the collection of data
through observation and experimentation,
data analysis, drawing conclusion, and
writing scientific report.
The concept of scientific investigation
The scientific method is the basic skill
needed in the world of science. Always
humans are curious on why and how things
happen in the world around. The scientific
method provides scientists with a well-
structured scientific platform to help find
the answers to their questions.
Commonly, a scientific method is a set of
techniques used by scientists to investigate
a problem or answer questions.
Basic steps of scientific investigation
Scientists including physicists are always
looking for scientific evidence. A systematic
search for evidence is recommended during
Student's Book Form One
Introduction to laboratory practice
and after experiments. The following
are steps followed when carrying out a
scientific investigation.
1. Problem identification
This is the first step in the scientific method.
It is when one makes a puzzling observation.
An example of such an observation would
be 'What is the relationship between the
length of the string to which the pendulum
bob is attached to the time taken by the
pendulum to complete a given number of
oscillations'?
2. Formulating a testable hypothesis
A hypothesis is a scientific assumption or
prediction of the outcome. It is a suggestion
of the answer to the question asked. For
example, 'Length of the string to which
the pendulum bob is attached affects the
time taken by a pendulum to complete a
given number of oscillations'.
FACT: In science we never prove an
hypothesis through a single experiment
because there is a chance that you made
an error somewhere along the way. What
you can say is that, your results support
or do not support the original hypothesis.
3. Performing an experiment
An experiment is a test under controlled
conditions. In this case, the aim of the
experiment is to determine whether the
formulated hypothesis is true or false. In
an experiment, variables are used to test the
hypothesis. Variables are those conditions
in an experiment that can change or be
changed, so as to obtain a set of values.
There are three different types of variables,
namely; dependent, independent, and
controlled variables.
(a) Dependent variable: A variable which changes if the experimental condition
changes. For example, the dependent variable is the time it takes for the pendulum
bob to complete a given number of oscillations.
(b) Independent variable: A variable which does not change even when the experimental
condition is changed. For example, length of the pendulum bob is independent
variable.
(c) Controlled variable: This is a variable that is kept constant during an
For example, the number of oscillations is a controlled variable.
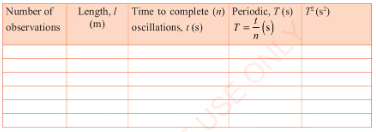
4. Data collection and analysis
Data collection involves recording what has been observed during the experiments. The
observed results are tabulated (recorded in a table form) and ready for analysis. This
involves ploting graphs, calculating mean, standard deviation, and errors. The results
of the experiment can be recorded as shown in Table 2.9.
Table 2.9:
Length of the string to which the pendulum bob is attached and time taken
to complete number (n) of oscillations.
5. Data presentation and interpretation
Data presentation involves the use of
charts, graphs and mathematical formulae.
Drawing graphs in science
For all graphs plotted from experimental
data, it is important to remember that you
should not connect the dots. Data will not
always follow a line or curve perfectly. By
obtaining several experimental data points
any discrepancies in each data point can
be removed. The data points plotted should
be fitted by drawing a best line that passes
through most of the points.
The graphs you plot must have the
following features:
(a) An appropriate scale is used for each
axis so that the plotted points must
occupy enough axis/space (work out
the range of the data and the highest
and lowest points).
(b) The scale must remain the same along
the entire axis and should use easy
intervals such as 10 s, 20 s, 50 s. Use
graph paper for accuracy.
(c) Each axis must be labelled with what
is shown on the axis and must include
the appropriate units in brackets, e.g.
Temperature (°C), time (s), height
(cm).
(d) The independent variable is generally
plotted along the x-axis, while the
dependent variable is generally plotted
along the y-axis.
(e) Each point has an x and y co-ordinate
and should be plotted with a symbol
which can be easily seen, e.g., a cross
or circle.
(f) A best fit line should be drawn to the
graph.
(g) Do not start the graph at the origin
unless there is a data point for (0,0),
or if the best fit line runs through the
origin.
(h) The graph must have a clear,
descriptive title which outlines the
relationship between the dependent
and independent variable.
(i) If there is more than one set of data
drawn on a graph, a different symbol
(and/or colour) must be used for
each set and a key or legend must be
included to define the symbols.
(j)Use line graphs when the relationship
between the dependent and independent
variables is continuous.
(k) For a line graph, you can draw a line
of best fit with a ruler. Make sure the
number of points are distributed fairly
and evenly on each side of the line.
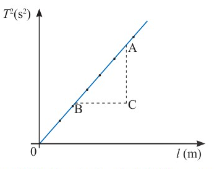
Introduction to laboratory practice
Example of a graph of period, 72 (s²)
against length /(m) is shown in Figure
2.26.
(l)In an exponential graph a best fit line
should be drawn by using freehand.
After recording and analyzing the data, you
may look for possible trends or patterns
and explain why they occur that way. For
instance, physicist may notice that as the
length of the string to which the bob is
attached increases, the time to complete a
given number of oscillation also increases.
This pattern forms the basis on which
evidence can be obtained.
6. Drawing a conclusion
A conclusion is a summary of the result of
the experiment. It includes a statement that
either proves or disapproves the hypothesis.
For instence, 'Length of the string to which
the pendulum bob is attached affects the
time taken by a pendulum to complete
a given number of oscillations' proves
our hypothesis. The experiment may be
repeated to make sure the results obtained
are reliable.
7. Reporting results
Scientists communicate their results to
others in a final scientific report. It is
very important to communicate scientific
findings to the public
in the form of scientific
publications, at scientific
conferences, in articles, TV
or radio programmes. The
experimental results are
presented in a specific format,
so that others can read your
work, understand it, and
repeat the experiment. The
structure of a good scientific
report includes:
(a)
Aim
- a brief sentence
describing the purpose
of the experiment;
(b)
Apparatus
- a list of the
apparatus or equipment;
(c)
Method
- a list of the
steps followed to carry
out the experiment;
(d)
Results
- tables, graphs
and observations about
the experiment;
(e)
Discussion
- what your
results mean; and
(f)
Conclusion
- a brief sentence concluding
whether or not the aim was achieved.
Note:
If your results do not
support the hypothesis:
(a) do not leave out the experimental results;
(b) suggest possible reasons for the difference
between your hypothesis and the experimental
results; and
(c) suggest ideas for further
investigations so as
to find answer to the
problem.
Scientific method flow chart
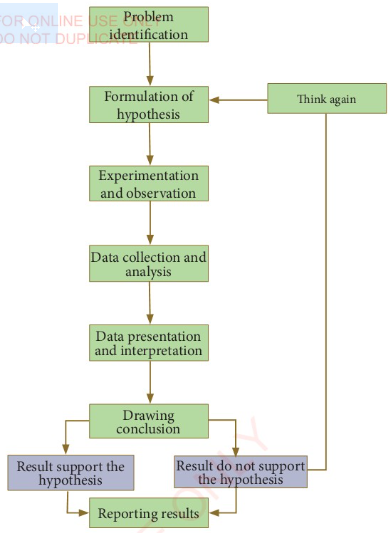
Task 2.5
In a group of 3 or 4 students study the flow chat
provided in Figure 2.27, then discuss the following
questions:
1. Once you formulate a research problem explain,
why is it important to conduct background
research before doing anything else?
2. What is the difference between a dependent,
independent, and controlled variable and why
is it important to identify them?
3. What is the difference between identifying a
problem, a hypothesis, and a scientific theory?
4. Why is it important to repeat your experiment
if the data fits the hypothesis?
Activity 2.1
In this activity you are required to
design your own experiment. Use the
information provided below and the
scientic method flow chart outlined.
previously to design your scientific
experiment. The experiment should be
handed in 1-2 page report. Below are
basic steps to follow when designing
your own experiment.
1. Ask a question which you want to
find an answer.
2. Perform background research on
your topic of choice.
3. Write down your hypothesis.
4. Identify important variables of your
investigation; those that are relevant
and you can measure or observe.
5. Decide on the independent and
dependent variables in your
experiment and variables that must
be kept constant.
6. Design the experiment that you will
use to test your hypothesis:
(a) State the aim of the experiment.
(b) List all the apparatus
(equipment) that will be used
in your experiment.
(c) Write the method that will be
used to test your hypothesis
in the correct sequence, with
each step of the experiment
numbered.
(d) Indicate how the results should
be presented and what data are
required.
Do Activity 2.1
Activity 2.2
Aim:
To apply the scientific
investigation method in
order to test the accuracy
of stopwatches.
Materials:
Sellotape, table, pendulum
bob, string, retort stand,
analogue, and digital
stopwatches.
Procedure
1. Arrange a simple pendulum system
as shown in Figure 2.28.
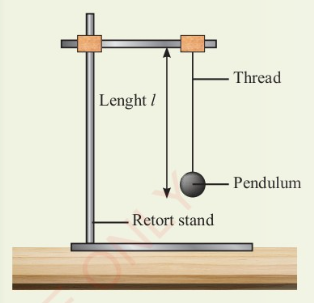
2. Pull the bob slightly to one side then
release it so that it swings back and
forth.
3. Using analogue stopwatch, measure
the time the pendulum takes to swing
back and forth.
4. Record your observation for one
complete oscillation.
5. Repeat steps 3 and 4 using the digital
stopwatch instead of the analogue one.
Do Activity 2.2
Questions
With reference to the pendulum bob,
use the scientific method outlined
previously to investigate whether the
digital stopwatch is more accurate than
the analogue stopwatch in measuring the
time taken to complete one oscillation.
Briefly address the following:
(a) Develop a hypothesis;
(b) Design and conduct an experiment
to test the hypothesis;
(c) Draw a conclusion from the
experiment;
(d) After comparing the measurements,
which stopwatch do you think is
more accurate than the other? And
(e) Write a report explaining your
experiment and conclusions.
The measurement from a digital stopwatch
is more accurate than the one from an
analogue stopwatch. The digital stopwatch
therefore, gives a more precise measurement
of time than the analogue one.
Task 2.6
1. Discuss with your teacher the steps
for carrying out experiments using
the scientific method.
2. In groups of five students, discuss
the application of the scientific
investigation method for a simple
pendulum.
3. Briefly explain the importance of
forming hypothesis before doing an
experiment.
Chapter summary
1. A laboratory is a special room that
has been designed and equipped for
carrying out scientific experiments
for the purpose of study or research.
2. Laboratory rules and safety measures
should be observed while carrying
out experiments in the laboratory.
This is to ensure your safety and that
of the other laboratory users.
3. First Aid is the immediate assistance
injured or care given to a sick or
person before getting a professional
medical help.
4. Items for rendering First Aid are
contained in the First Aid kit.
5. First Aid helps to save life; it prevents
the victim's condition from becoming
worse, promotes recovery by bringing
hope and encouragement, helps to
reduce pain and suffering and also
prevents infection.
6. First Aid can be given to victims of:
electric shock, cuts or wounds and
fainting.
7. Warning signs show whether a
substance is harmful, toxic, irritant,
flammable, oxidant, corrosive,
explosive or can easily break.
8. Warning signs must be read and
understood so as to avoid accidents
in the laboratory.
9. Apparatus used in a Physics
laboratory are tools and instruments
required for effective learning and
teaching of Physics.
10. The scientific method is a procedure
used by scientists to investigate a
problem or answer questions.
11. The scientific investigation method
is divided into several steps,
namely: problem identification,
asking questions, formulating a
testable hypothesis, performing
an experiment, data collection
and analysis, data presentation,
data interpretation, and drawing a
conclusion.
Section A
Choose the most correct answer
1. When a large body of experimental
evidence supports or does not
support a hypothesis, what may
the hypothesis eventually be considered?
(a) Observation.
(b) Insight.
(c) Conclusion.
(d) Law.
2. Which of the following best describes
a variable?
(a) A trend that shows an
exponential relationship.
(b) Something whose value can
change over multiple
measurements.
(c) A measure of how much a plot
line changes along the y-axis.
(d) Something that remains constant
over multiple measurements.
3. Write TRUE for correct and FALSE
for incorrect statements for each of
the following:
(a) You should move a victim of
electric shock using a metallic
object.
(b) First aid helps to save life.
(c) Eating in the laboratory is
prohibited.
4. Fill in the blanks.
(a)__is an immediate
assistance given to a__
before getting professional
medical care.
(b) Take the victim to__
if he or she does not regain
consciousness.
Section B
5. Briefly answer the following
questions.
(a) What is a physics laboratory?
(b) List ten laboratory rules.
(c) Name five items found in a First
Aid kit and state their uses.
(d) Why it is necessary to wear
gloves when giving First Aid
to a bleeding person?
6. Outline four features of a good
laboratory.
7. What should you do in the laboratory
in the event of the following
situations?
(a) You need to carry out an
experiment but there is nobody
in the laboratory.
(b) You have just finished your
physics experiments for a day.
(c) Your partner is cut by glass
during the experiment.
(d) You want to burn waste papers.
(e) Your partner breaks a beaker.
(f) You have water and you want
to drink it.
(g) One of your partners suggests
that you take the apparatus out
of the laboratory in order to
finish the experiment at home.
(h) Your partner wants to insert a
bare wire in an electric plug.
8. State six classes of fire and their most
appropri ate fire extinguishers.
9. What are warning signs?
10. What do the following warning signs
mean?


11. Draw the following apparatus and
state its uses:
(a) Beaker.
(b) Thermometer.
(c) Micrometer screw gauge.
(d) Spring balance.
(e) Measuring cylinder.
12. Why is it important for all apparatus
used in electrical experiments to be
thoroughly dried? Explain.
13. (a) What is a scientific method?
(b) Use a diagram to name all the
steps involved in a scientific investigation.
(c) As part of their study, Form
2 students were asked to find
out whether girls in their class
perform better than boys in
physics. If you were one of
them:
(i) ask the questions;
(ii) propose the hypothesis;
(iii) carry out an experiment to
test your hypothesis; and
(iv) draw a conclusion from
your experiment.
14. A student investigated the strength of
different fridge magnets by putting.
small sheets of paper between each magnet and the fridge door. The student
measured the maximum number of sheets of paper that each magnet was able to
hold in place. Why was it important that each small sheet of paper had the same
thickness?
Before starting the investigation, the student wrote the following hypothesis, 'The
bigger the area of a fridge magnet the stronger the magnet will be'. The student's
results are given in Table 2.10.
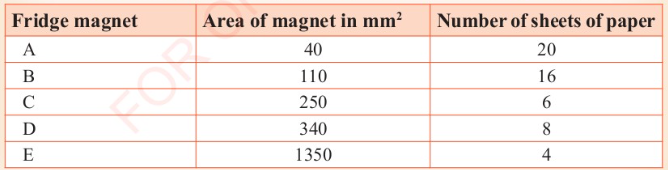
Give one reason why the results from the investigation do not support the student's
hypothesis.